
/ Upfront carbon
Which structure carries the least upfront carbon?
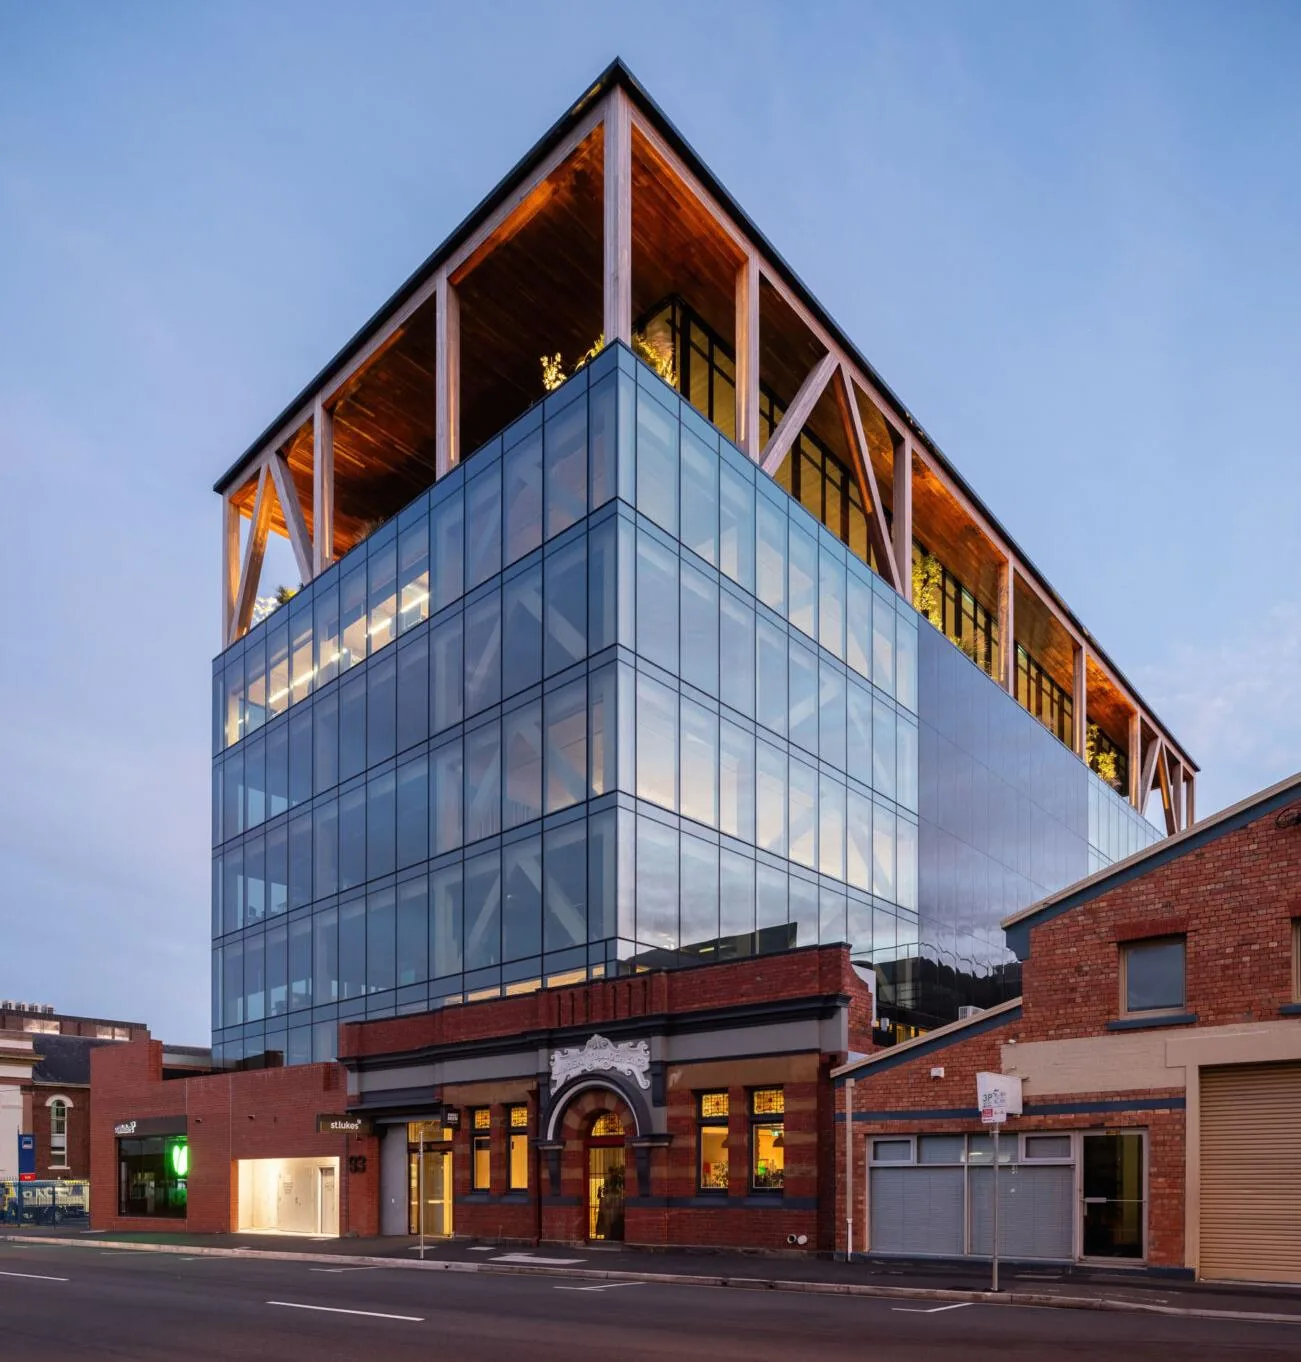
St Luke’s Health Headquarters, Launceston, Tasmania. Three structural systems for an eight-storey office building, compared across life-cycle stages A1–A5.
for the mass timber option, the lowest of the three
- Building type
- Office building
- Location
- Launceston, Tasmania, Australia
- Scale
- 8 storeys, 8,062.4 m² GFA
- Life-cycle stages
- A1–A5
- Structural options
- Post-tensioned concrete, reinforced concrete, mass timber
- Tools and data
- NABERS-based (A1–A3), One Click LCA (A4–A5)
Overview
This study evaluates how the choice of structural system changes the upfront embodied carbon of St Luke’s Health Headquarters. Three alternatives were compared: post-tensioned concrete, reinforced concrete and mass timber. Material production, transport to site and construction activities were assessed together, so the comparison reflects the carbon released before the building opens rather than the product stage alone.
The challenge
The question was asked at an early design stage, while the structure was still open. How much could the choice of structural system change upfront carbon once production (A1–A3), transport (A4) and construction (A5) were counted together?
Structural systems compared
Upfront carbon per square metre of GFA, split by life-cycle stage. Mass timber comes in about 25% below reinforced concrete and about 10% below post-tensioned concrete.
| System | A1–A3 | A4 | A5 | Total |
|---|---|---|---|---|
| Mass timber | 77.14 | 0.80 | 11.54 | 89.5 |
| Post-tensioned concrete | 94.35 | 1.49 | 4.06 | 99.9 |
| Reinforced concrete | 112.94 | 1.81 | 4.88 | 119.6 |
Methodology
A hybrid approach, using the tool best suited to each group of stages.
A1–A3 with NABERS
Embodied carbon from production and upstream processes, quantified with Australian datasets.
A4–A5 with One Click LCA
Transport and construction impacts, quantified from material quantities, EPDs and Green Star benchmark data.
Biogenic carbon, reported separately
In line with NABERS practice, carbon stored in timber is shown on its own rather than subtracted as a negative emission. Gross emissions stay visible, and so does the storage.
Mass timber results
Gross upfront emissions and the carbon stored in the timber, reported side by side.
Emitted and stored
The timber structure stores a little over twice the carbon released to build it. The two figures are reported separately and are not netted off.
Where the emissions sit
- Vertical structures72%
- Foundations and substructure15%
- Horizontal structures8%
- Steel connections4%
- Stairs1%
Transport and sourcing
The A4 results showed truck transport as the larger part of transport emissions, ahead of shipping. Road freight moved larger quantities and carries a much higher emission factor: 0.1 kg CO₂e/tkm against 0.0057 kg CO₂e/tkm for shipping, roughly 17 times higher per tonne-kilometre.
For a project in Tasmania, that makes local sourcing and the road leg of each supply route worth checking early.
kg CO₂e per tonne-kilometre
Conclusion
Within the scenarios assessed, mass timber was the lowest-upfront-carbon structural option. The study shows how early structural choices, material sourcing and transport strategy can materially change embodied carbon, and why those decisions are worth testing before the structural system is fixed.