
/ Outdoor thermal comfort
How do you keep a coastal precinct walkable in an Abu Dhabi August?
Saadiyat Island Residential Precinct, Exit 14, Abu Dhabi. A pedestrian-scale outdoor thermal comfort study that finds the critical summer day, maps where heat stress builds up, and tests three ways to cool the public realm.
with trees and shade structures
- Project type
- Residential precinct, outdoor public realm
- Location
- Saadiyat Island, Abu Dhabi, UAE
- Critical day
- 12 August, 06:00–22:00
- Metrics
- UTCI, MRT, thermal comfort percentage, hotspot area
- Hotspot threshold
- UTCI > 30 °C
- Tools
- Ladybug, Honeybee, EPW climate data
Overview
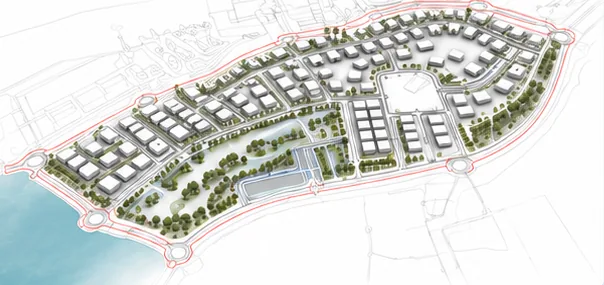
The precinct sits on the coast of Saadiyat Island, with low-rise residential blocks around large open parcels, landscaped streets and direct access to the beach. The study looked at the outdoor spaces people actually walk and sit in, at pedestrian height, to find what drives heat stress there and which design moves reduce it.
The challenge
In a hot-arid coastal climate, air temperature is only part of the story. Strong sun heats people and hard surfaces directly, and paving and façades re-radiate that heat for hours. The question was where on the site this radiant load makes outdoor spaces uncomfortable, and whether paving, façade colour or shade does the most to fix it.
Finding the critical day
Four representative days covering winter, the transition seasons and the summer peak. 12 August shows the highest UTCI and became the design case for everything that follows.
| Condition | Representative day | UTCI range | Reading |
|---|---|---|---|
| Winter | 04 Feb | 7.68–19.52 °C | Low UTCI, generally comfortable |
| Transition | 22 Apr, 15 Oct | 12.95–28.42 °C | Moderate rise, local warm pockets |
| Summer peak | 12 Aug | 21.22–31.36 °C | Highest stress, critical design case |

Summer peak baseline
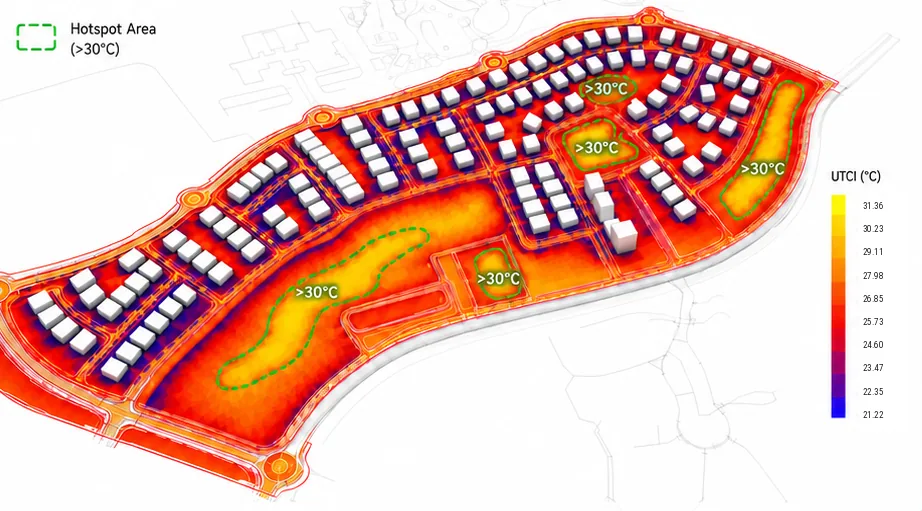
On 12 August, mean UTCI across the site is 27.18 °C and the peak reaches 31.36 °C. The hottest spots cluster in the large central open parcel, along the eastern edge and in a northern pocket, where there is little shade and a lot of exposed hard surface.
- Mean UTCI
- 27.18 °C
- Area-wide moderate heat stress. Peak 31.36 °C.
- Mean MRT
- 35.22 °C
- Radiant exposure is a major part of the discomfort.
- Peak MRT
- 53.08 °C
- High local solar and radiant load in exposed areas.
- Hotspot area
- 10,421 m²
- Ground where UTCI exceeds 30 °C.
- Summer comfort
- 57.84%
- Thermal comfort percentage. A large share stays outside comfort.
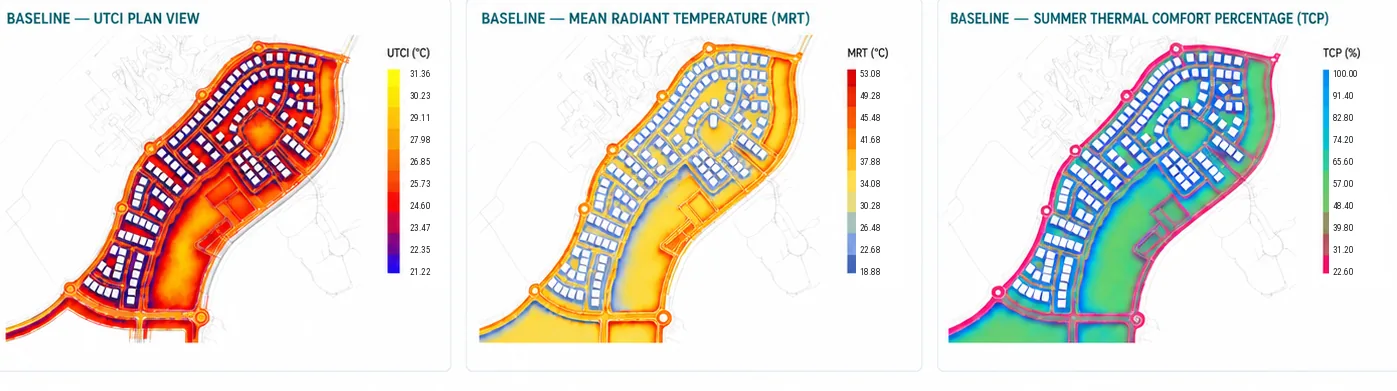
The MRT and UTCI maps follow each other closely. Mean radiant temperature combines direct, reflected and emitted radiation, so where people are exposed to sun and hot surfaces they feel much hotter than the air temperature suggests. That points to shade as the main lever, with surface treatments as support.
Three ways to cool the precinct
Each scenario targets a different part of the heat problem and was run on the same summer peak day.
Scenarios tested
01 Permeable asphaltPorous paving to reduce heat stored in the hardscape.
02 White façadesWhite-painted building façades to absorb less sun.
03 Trees + shade structuresStreet trees and lightweight canopies over routes, seating and open spaces to block direct sun.
Hotspot area
Area with UTCI above 30 °C, m², 12 August
Trees and shade remove 5,638 m² of hotspot, a 54.1% reduction. Permeable asphalt removes 25.3%. White façades barely change it, at 0.8%.
| Scenario | Mean UTCI | Peak UTCI | Mean MRT | Peak MRT | Hotspot area | Hotspot change | Comfort |
|---|---|---|---|---|---|---|---|
| Baseline | 27.18 °C | 31.36 °C | 35.22 °C | 53.08 °C | 10,420.80 m² | — | 57.84% |
| 01 Permeable asphalt | 27.12 °C | 31.20 °C | 34.98 °C | 52.58 °C | 7,785.60 m² | −25.3% | 58.35% |
| 02 White façades | 27.16 °C | 31.29 °C | 35.11 °C | 52.86 °C | 10,337.45 m² | −0.8% | 58.02% |
| 03 Trees + shade | 26.57 °C | 31.02 °C | 33.19 °C | 51.76 °C | 4,783.20 m² | −54.1% | 62.05% |
Scenario 03 on the summer peak
With trees and shade structures, mean MRT drops by 2.03 °C and mean UTCI by 0.61 °C, and the thermal comfort percentage rises by 4.21 points, from 57.84% to 62.05%.

Conclusion
Shade does the most. Trees and shade structures cut the summer hotspot area by more than half and give the best result on every indicator, so the recommended direction is to put them first across the persistent hotspots and the main pedestrian routes.
Permeable or cool paving is a useful second layer where large paved areas store heat. White façades on their own change little at street level. A combined strategy led by shade and vegetation, backed by targeted paving changes, is the clearest path to a more comfortable public realm.