
/ Energy and daylight
How far can early design cut a Florida home’s energy use?
A two-storey residence in Fort Lauderdale, Florida. Passive and active strategies tested one by one in a hot-humid climate, then combined, with a full annual daylight study.
from 20.78 to 12.05 kBtu/ft²
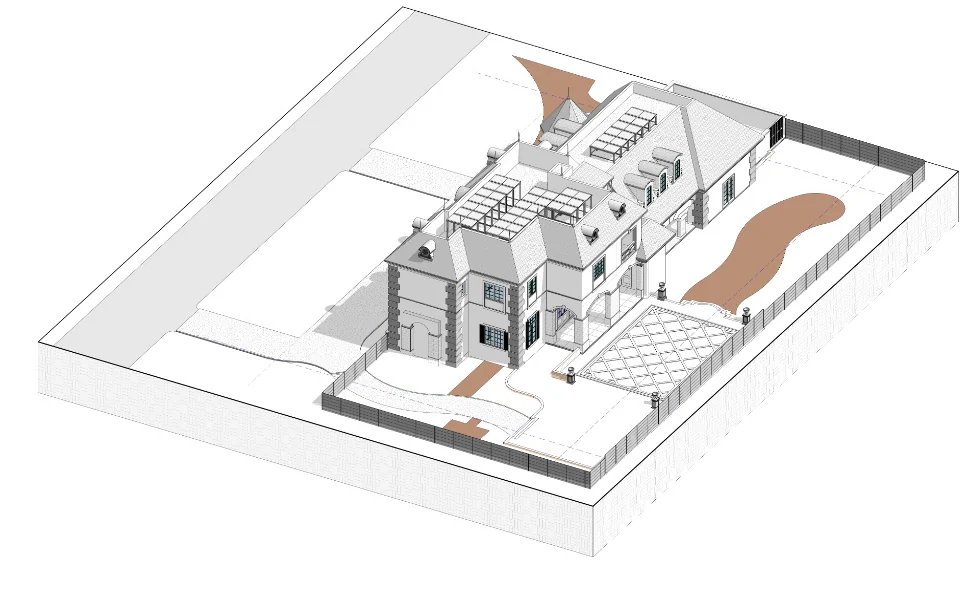
- Building type
- Single-family residence, 2 storeys
- Location
- Fort Lauderdale, Florida, USA
- Site
- 190′ × 135′ lot, 35′ height limit
- Climate
- Hot-humid, Köppen Aw
- Standard
- ASHRAE 90.1-2019 baseline
- Tools
- Ladybug, Honeybee (EnergyPlus, Radiance), Octopus
Overview
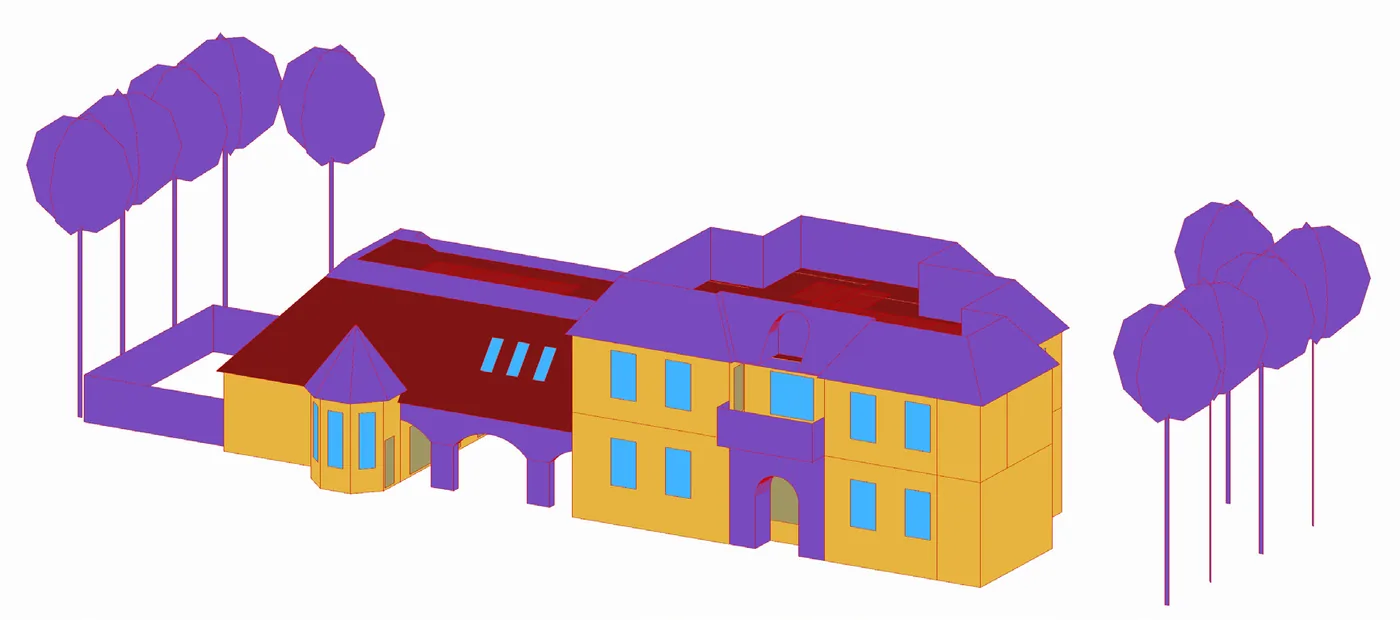
This study set out to consider building performance as early in the design as possible for a classical French-style urban residence. A baseline energy model was built from the architectural model to ASHRAE 90.1-2019, then orientation, window-to-wall ratio, insulation, HVAC system and rooftop PV were each tested against it. The daylight performance of the design was assessed alongside.
The challenge
Fort Lauderdale has long, hot and very humid summers, mild winters and more than 3,000 hours of sunshine a year. Cooling and dehumidification dominate, heating is close to zero, and strong sun is both a load to control and a resource for daylight and solar power. The question was which design moves actually change the energy use of a large home in this climate.
Where the energy goes
Baseline end-use breakdown, kBtu/ft². Plug loads and cooling account for nearly four fifths of the total; heating is negligible.
- Electric equipment10.571
- Cooling6.007
- Interior lighting3.978
- Fans0.178
- Heating0.044
Passive strategies
Each parameter varied on its own, with everything else held at the baseline.
Orientation
Rotation from the current layout, EUI kBtu/ft²
The current orientation is already the best of those tested, so no rotation is needed.
Window-to-wall ratio
WWR, EUI kBtu/ft²
10% WWR gives a 2.8% reduction. Smaller windows cut cooling but also daylight, so this has to be read with the daylight results below.
Insulation
EUI kBtu/ft² by wall insulation (columns) and roof insulation (rows)
| Roof \ Wall | 0″ | 2″ | 3″ | 4″ | 5″ |
|---|---|---|---|---|---|
| 0″ | 20.777 | 20.510 | 20.430 | 20.394 | 20.366 |
| 4″ | 20.710 | 20.461 | 20.385 | 20.347 | 20.316 |
| 6″ | 20.712 | 20.462 | 20.385 | 20.347 | 20.317 |
| 8″ | 20.703 | 20.454 | 20.378 | 20.339 | 20.310 |
5″ wall and 8″ roof insulation gives the lowest EUI, a 2.2% reduction. Beyond this point the extra savings are too small to justify the cost and space.
Active strategies
Alternative HVAC systems and a rooftop PV array, each compared with the baseline.
HVAC system
EUI kBtu/ft², baseline system marked
The best system is 5.7% below the baseline heat pump.
Rooftop PV
Tilt and azimuth optimised in Grasshopper with the Octopus solver, for maximum annual irradiance per square metre
- Panels
- 23
- Azimuth
- 182°
- Tilt
- 58°
- Annual generation
- 37,898 kBtu
- EUI on its own
- 15.608 kBtu/ft²
- Reduction
- 24.9%
PV gives by far the largest single reduction of the measures tested.
Combined effect
The measures applied in sequence, each step keeping the ones before it.
- Baseline20.777
- Orientation kept at 0°20.777
- + WWR 10%20.158
- + Insulation, 5″ wall and 8″ roof19.612
- + Residential AC with baseboard electric17.425
- + Rooftop PV12.051
EUI in kBtu/ft². Envelope measures give modest gains on their own; the efficient system and on-site generation do most of the work. Together they reduce EUI by 42%.
Daylight
Annual climate-based daylight metrics for the regularly occupied spaces, simulated in Radiance through Honeybee.
- Spatial daylight autonomy
- 72%
- sDA 300/50. Above the 55% LEED v4 threshold.
- Daylight autonomy
- 62.3%
- Share of occupied hours at 300 lux or more, averaged across spaces.
- Useful daylight illuminance
- 61.4%
- Share of time between 100 and 2,000 lux.
- Annual sunlight exposure
- 25.9%
- ASE 1000/250. Above the 10% LEED v4 limit.
- Average daylight factor
- 2.3%
- CIE overcast sky. 57% of floor area below 2%, 31% between 2 and 5%, 12% above 5%.
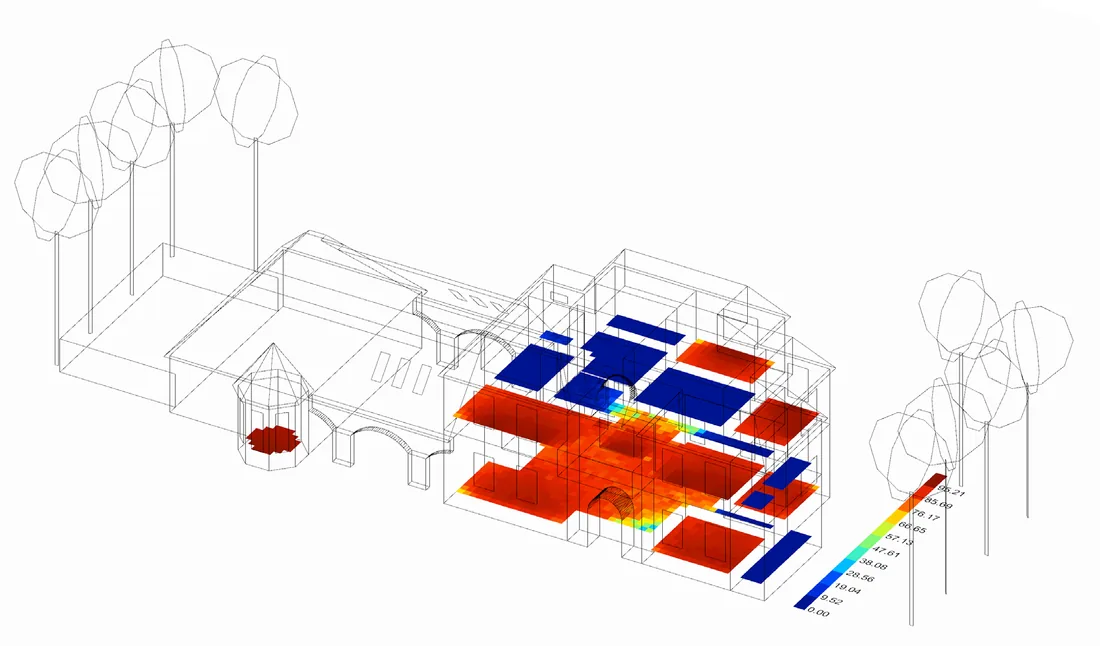
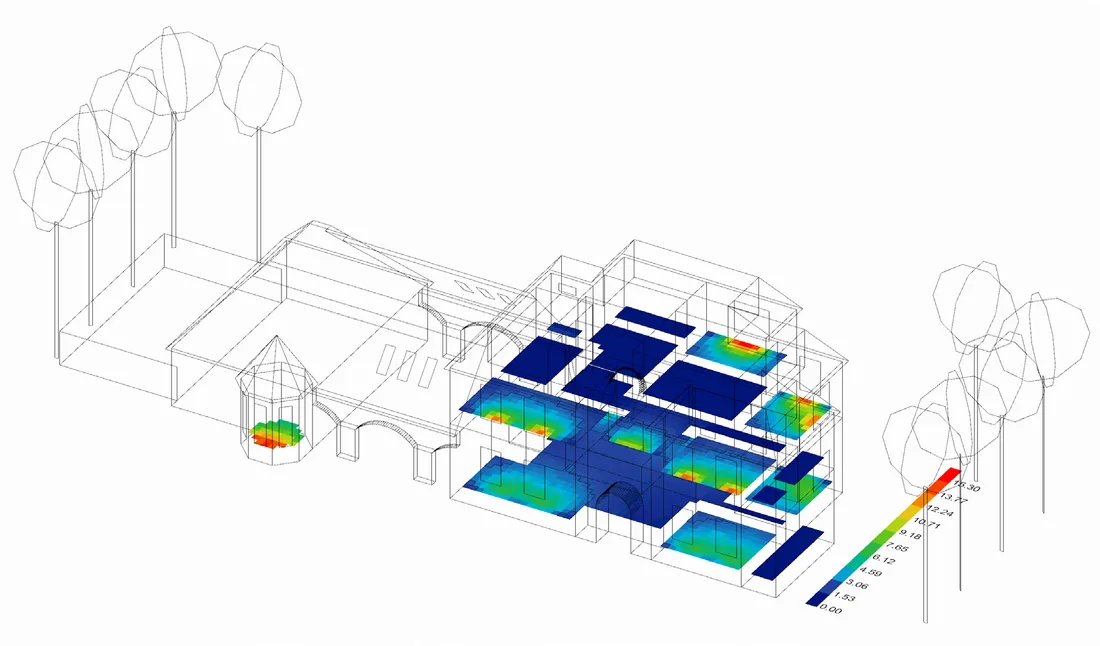
Most of the home is well daylit, but a quarter of the occupied area gets too much direct sun. Because ASE exceeds the LEED limit, the daylight credit is not met on these results alone. Fixed shading, deep window reveals and overhangs, and glazing with an SHGC below 0.25 were considered to bring sunlight exposure down while keeping the useful daylight.
Conclusion
In this climate, orientation and envelope changes alone move the numbers only slightly. The largest gains came from the HVAC choice and rooftop PV, and the combined package cut energy use intensity by 42%. The daylight study adds an important check: the same generous glazing that delivers good daylight autonomy also lets in too much direct sun, so shading and glazing selection need to be settled together with the window ratio.